
Using GIS To Evaluate Athletic Facility Needs

by Dave Peterson, PLA and Carter Marshall, PLA
To athletic directors and park directors, simple questions can sometimes be tough to answer.
How are we doing? How can we do better?
There are no accepted standards to evaluate important assets and programs.
Are our athletic fields adequate for our needs?
Do we need more fields?
How do we serve different sports?
What improvements are needed?
Where should we invest to be where we need to be in five years? In ten years?
No More Guess Work
There are ways to understand how well your athletic fields serve your community or users. This blog will share some insights from one project analyzing fields across the country. Using GIS (Geographic Information System) technology, our customized athletic fields analyses give concrete evidence that justifies planning decisions. Our work is based on specific needs and patterns of use. We have developed a proprietary scoring and analysis methodology called GRASP® (Geo-Referenced Amenities Standards Program).
GIS Analysis and Athletic Fields
GIS is a powerful tool widely used in technology, government, medical, and environmental science industries. GIS applications create digital models of the real world and provide tools for evidence-based analysis to inform justifiable, defensible planning decisions. Our customizable toolbox helps to identify gaps in programing and field assets and gives directors information they need to prioritize improvements.
Case Study: Baseball and Softball Diamonds in Stafford County, Virginia
Our team worked with Stafford County, Virginia, to complete a sports field analysis. We interviewed staff and park users to learn about capacity and demand for sports fields. We then targeted locations for new fields based on user access and population density.
In the past, field allocation was based on best guesses about future demand backed up by data points like which fields had waiting lists. This study gave Stafford County leadership evidence-based facts to justify their decisions.
How it Worked
Our team first identified all baseball and softball diamonds owned or maintained by Stafford County. Public school fields were also included as important practice facilities. A total of 45 ballfields were identified and located.
Initial GIS analysis showed excellent distribution and location of ballfields. Population data revealed that 96% of kids ages 5 – 19 have access to at least one diamond less than three miles from home.

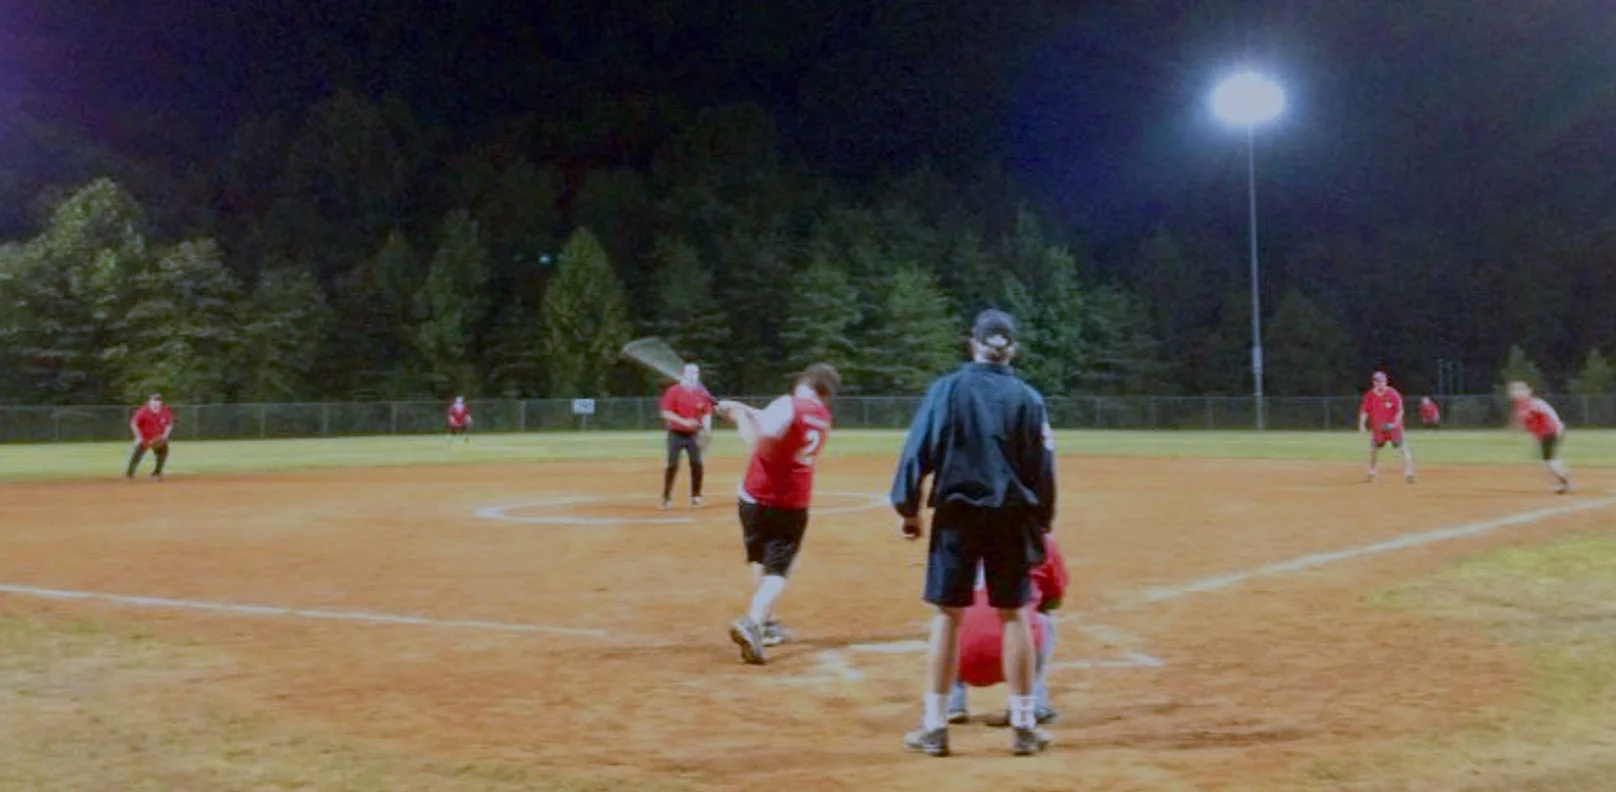
The study of ballfields in Stafford County improved public access and focused future development of new fields. Image courtesy of Stafford County.
Next, we conducted field evaluations for each of the 45 ballfields. Using a customized scoring system we assessed the value of each ballfield based on:
• overall field quality
• turf quality
• infield condition
• backstop condition
• dugout
• field fencing
• warm-up area/batting cage
• irrigation
• field lighting
• bleachers
• storage availability
• scoreboard | utilities
Scores were entered into a database. Nearby assets such as availability of restrooms, parking, security lighting, storage, drinking water, and concessions were also identified. These elements make a ballfield more inviting and comfortable, and were used to amplify the overall field scores. We calculated a total value for each ballfield and ranked them accordingly.
Final values were then displayed on a map that painted a clear picture of ballfield access.
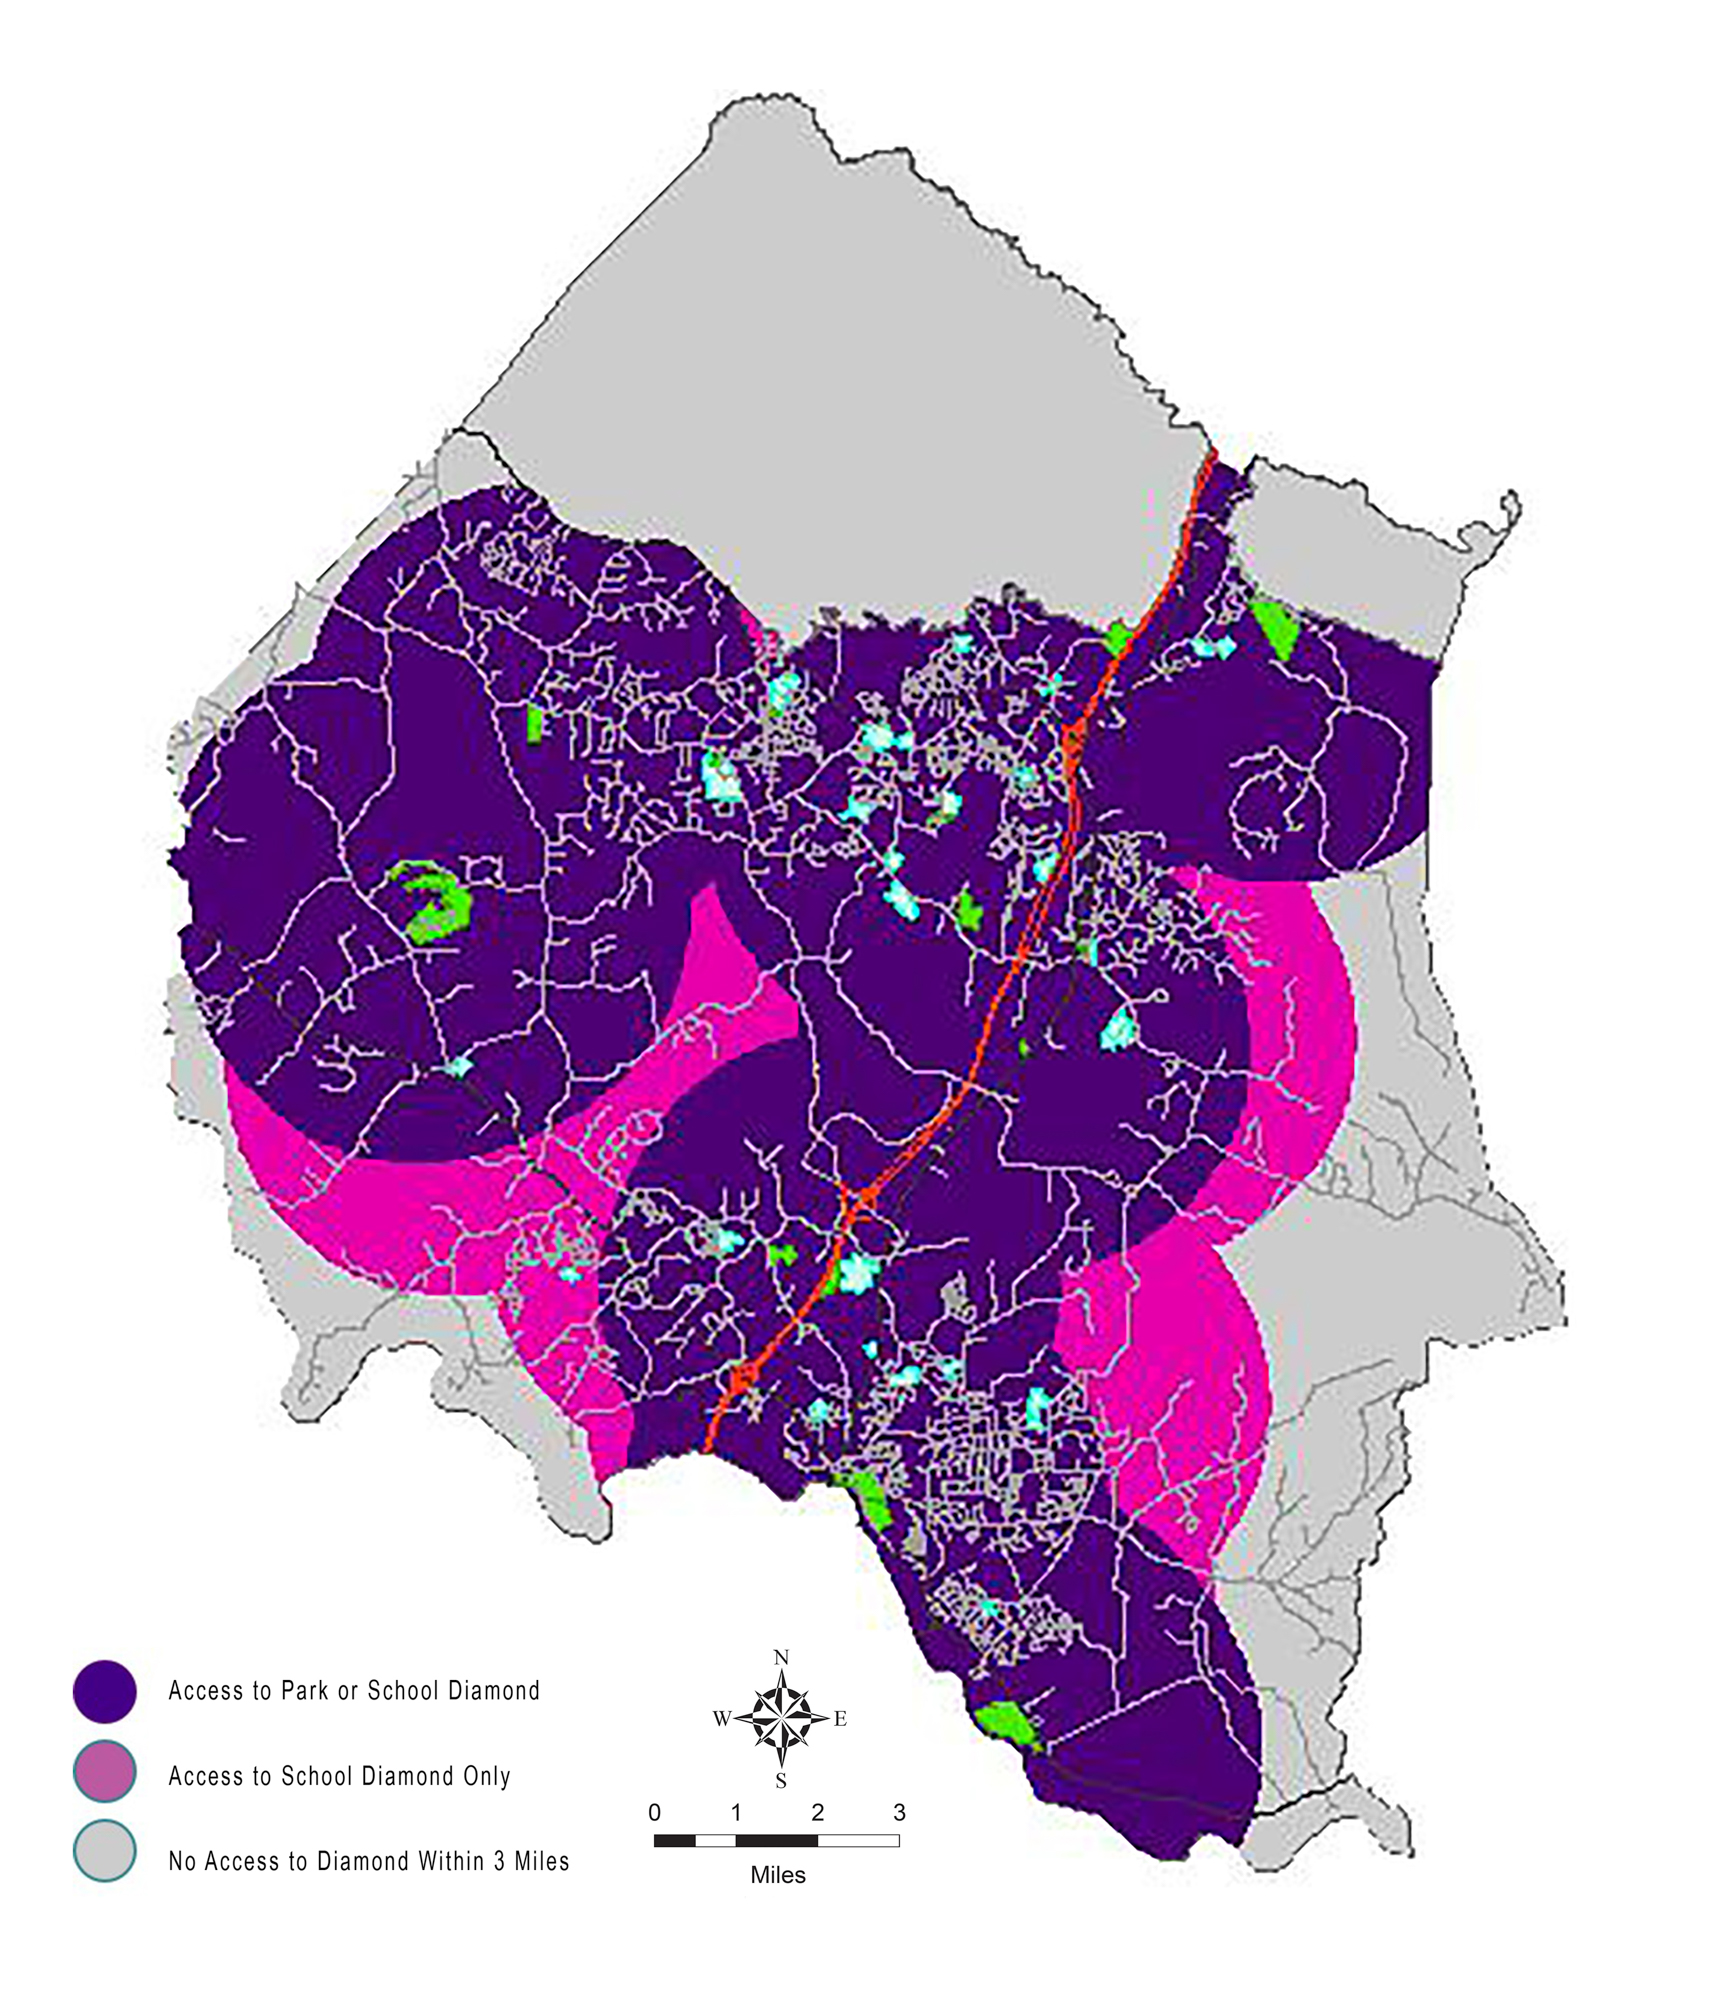
Initial analysis showed good field distribution and excellent youth access throughout the county.
The resulting “heat map” showed the cumulative value of all ballfields within three miles of any location in the study area, a distance that approximates a drive of twenty minutes or less.
The last step was to account for where the target users, young people aged 5 – 19, actually lived. We overlapped U.S. Census data with field scores to show yield the most important pattern: high numbers of young people living in areas with low field scores.
Clear Answers and Real World Impact
Now we had an answer to the tough questions!
How are we doing? What can we do better?
The answer was clear: two specific areas needed to add or improve ballfields. The GIS analysis justified additional funding for ballfield improvements.
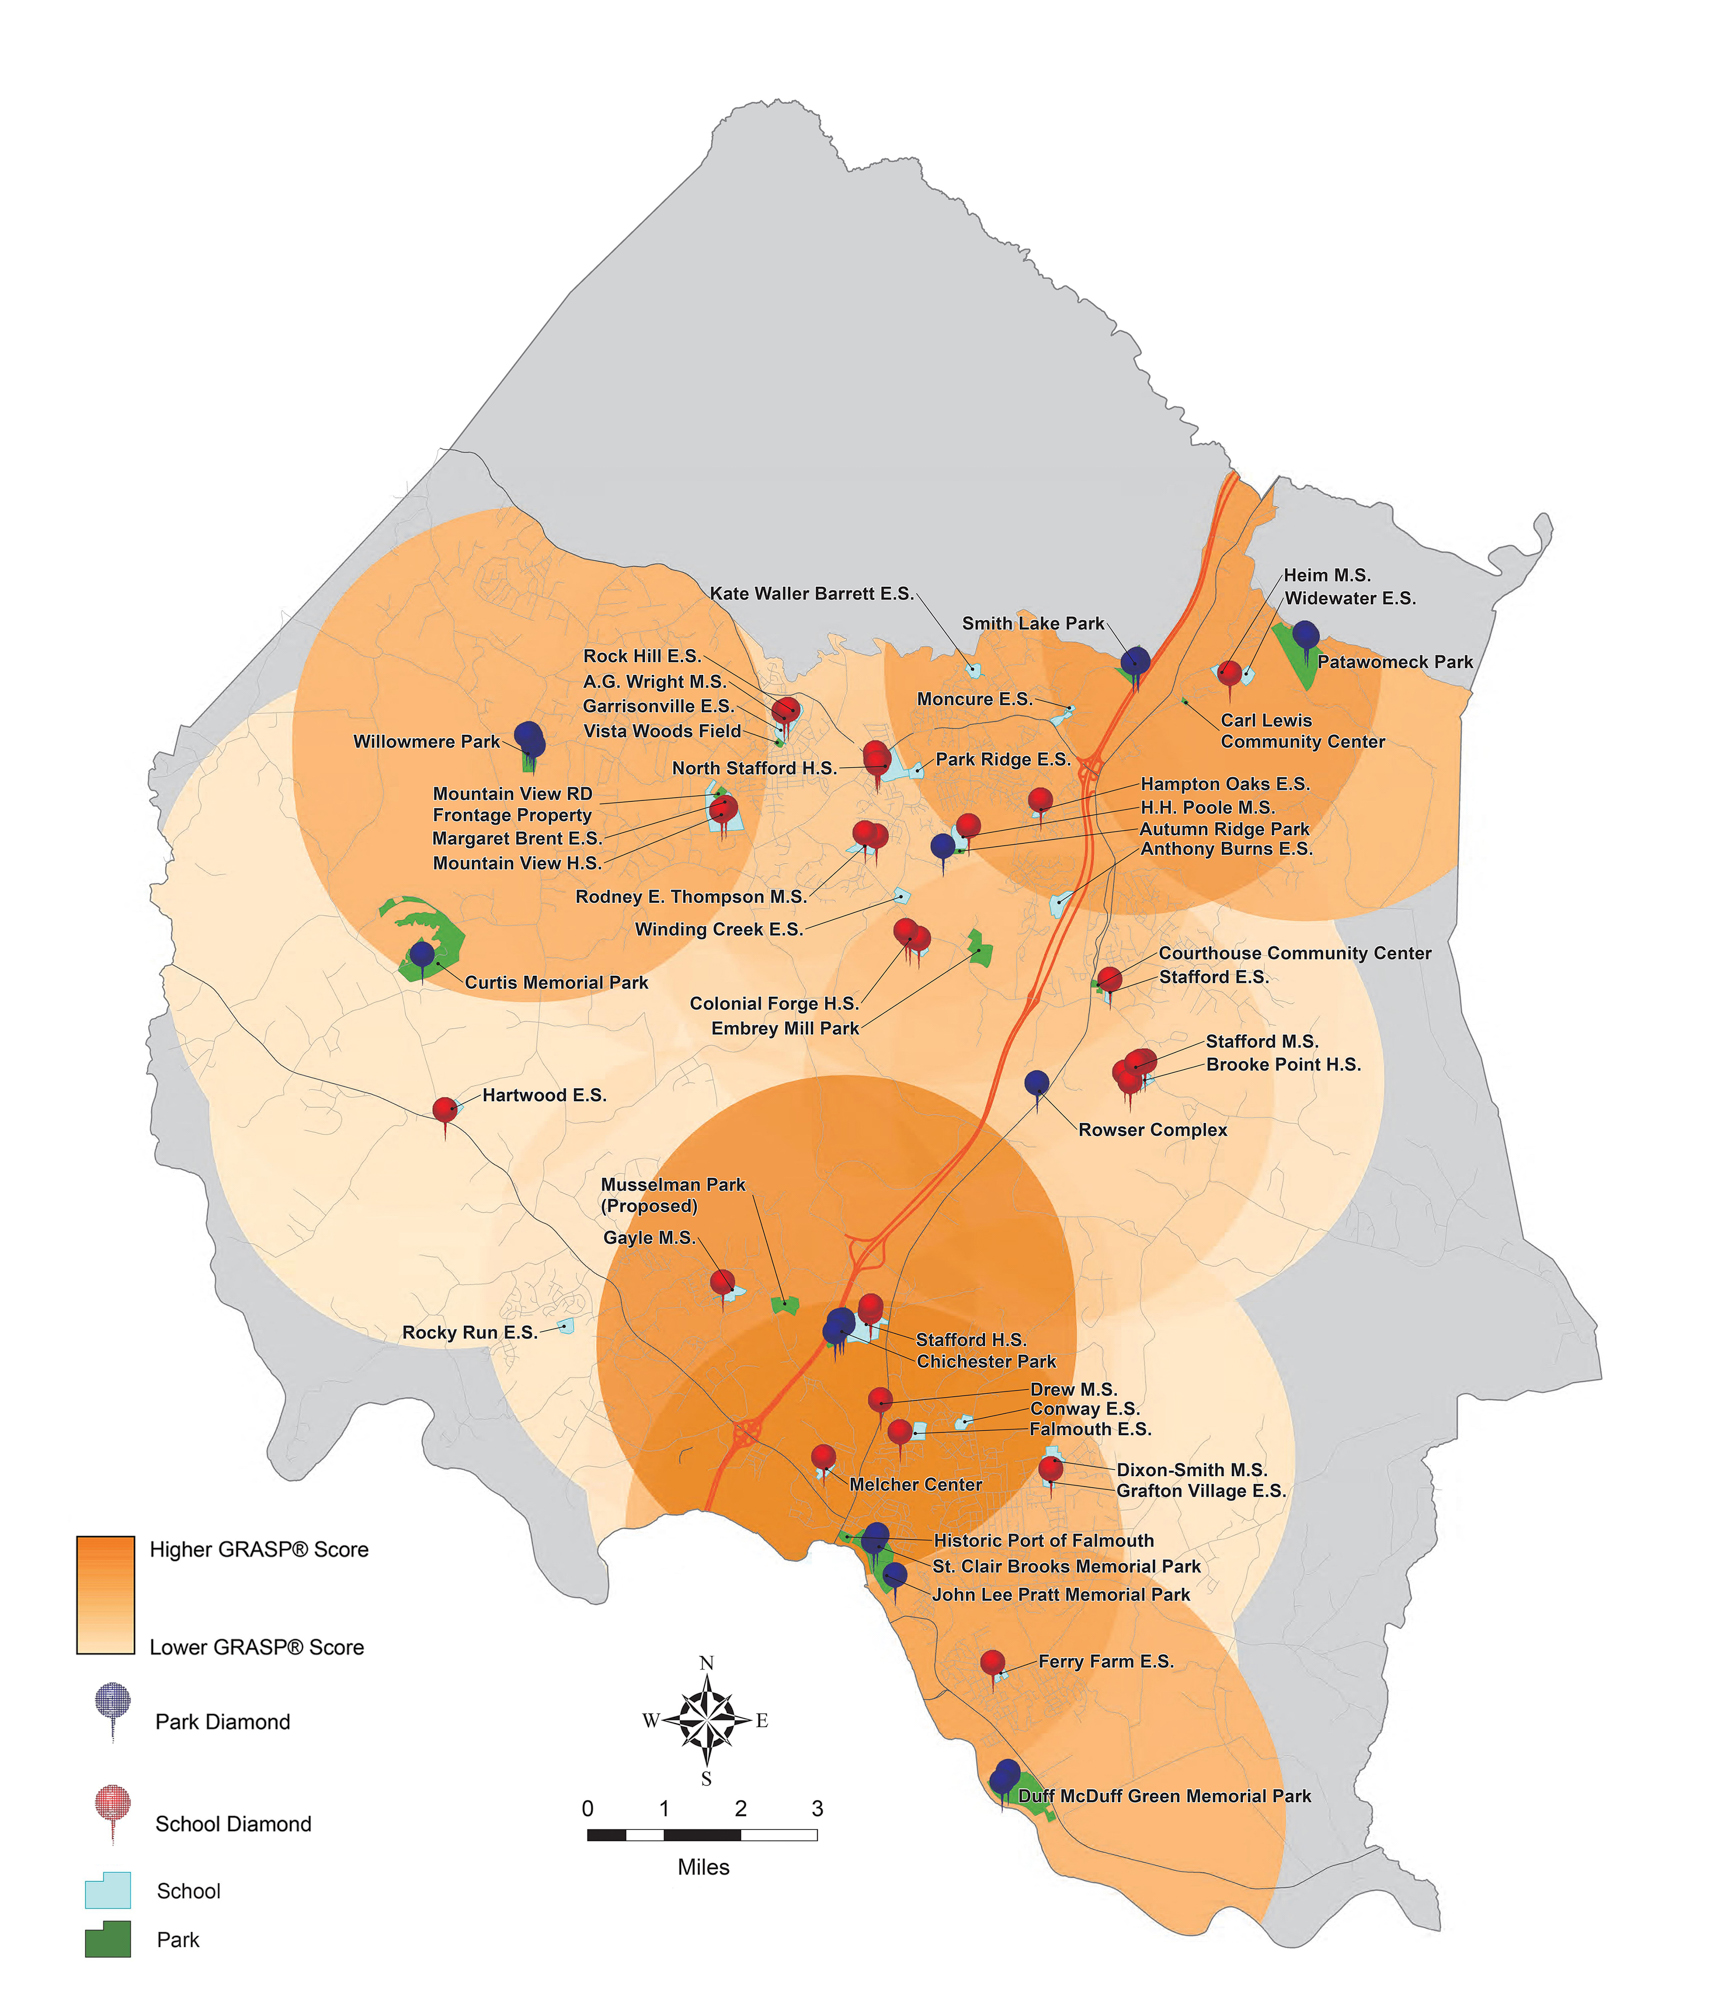
Target areas were revealed by combining demographic data with ballfield locations and scoring data
“Prioritizing projects and their locations based on the data collected and the results of the study, we are now confident in our investment choices knowing we are addressing actual needs,” says Jamie Porter, Director of Stafford County Parks, recreation and Community Facilities.
“We found out that we didn’t need new parks necessarily, we needed to enhance and build out current parks with the required amenities to address current and long term capacity.”
In many school and park districts funding allocation can be a high-stakes game. Want to win that game? Get solid evidence that prove the case for field planning expenditures.
If you want to learn more about GIS analysis for your athletic fields, leave a comment below, we'll get back to you right away.
This is part of a four-part series on athletic field design. See Erik Spring's post on understanding the basics of synthetic turf. Check back throughout August to see blogs on the changes new soccer standards mean for athletic fields and the ins-and-outs of replacing tennis courts.
