Research

Knock it Out of the Park! GIS Athletic Field Analysis

Knock it Out of the Park! GIS Athletic Field Analysis

Athletic and park directors get answers to tough questions. Find out how to assess the level of service your athletic fields are providing for your community. GIS (Geographic Information System) technology creates digital models. See how our team analyizes GIS data to create real world impact for your athletic field plans.

Robby Layton Receives Doctorate

Design Concepts, a community and landscape architecture firm, announces co-founder Robby Layton’s highest academic achievement in the discipline of landscape architecture: a Ph.D. in Design from North Carolina State University’s College of Design, received in December 2016.

At the core of Layton’s studies and dissertation was research on parks and other greenspace located near people’s homes.  Sophisticated methods were applied to determine which factors matter most for people’s opinion of how well greenspace meets public needs, and which ones play the greatest role in the frequency of park visits.  Layton studied community-wide parks and recreation systems in four communities:

  • Cary, North Carolina
  • Montgomery County, Maryland
  • Prince George’s County, Maryland
  • Tulsa, Oklahoma

Determining What Matters to Park Visitors

His findings show that traditional strategies of increasing available park acreage near homes, and reducing the distance from home to a park, are not reliable ways to improve residents’ opinions of the adequacy of the park system to meet needs. They also are not reliable ways to increase the frequency of park visits. Improving the quality of parks and assuring that parks respond to the characteristics of the people that live near them are more likely to achieve the desired results. New ways to measure park quality are needed to inform further research and lead to more effective planning guidelines and policies, such as the measurement of:

  • Comfort
  • Convenience
  • Safety and security
  • Aesthetics and beauty
  • Enjoyment
“With better measures of park quality, systems of greenspace can be planned to help achieve many public health and well-being goals including physical health, mental health, social health, environmental health, and economic health,” says Layton.

Design Concepts co-founder Axel Bishop commented on Layton’s doctorate that,

“Introducing this highest level of design, research, and thought to landscape architecture and our firm’s practice will open new doors in planning and design applications. Applying new thought processes and study of people in their environment is a trademark of our firm’s founding philosophy.  With Robby’s scholarly approach, we can build on this philosophy with the highest level of evidence-based design.”

About Robby Layton, PhD, FASLA, PLA, CLARB, CPRP

Robby Layton is a founding principal of Design Concepts, CLA, Inc., an award-winning landscape architecture and planning firm. His projects span four decades and address a wide range of challenges, but all of them converge on the theme of creating community. His recent work has focused on strategic planning for systems of parks, greenways, open space and other public amenities. He has just received his doctorate from North Carolina State University, where he investigated level of service (LOS) models for the allocation of public greenspace.  In addition to his design practice, Robby has taught a number of courses at the undergraduate and graduate levels. He writes for a variety of publications in the landscape architecture field and presents regularly at academic and trade conferences on a range of topics related to his areas of interest.

Reaching a New Level of Service – Getting Active

By John Rainey and Dave Peterson, PLA

For over a decade, the GRASP® Component Based method for Level of Service analysis has been the Gold Standard of community park system evaluation processes. Now we are adding a new element to this proven process: Active Participation Rates. Rather than simply determining acres of parks per 1,000 residents, GRASP® Active takes an approach that begins to equate parks and park access to physical activity and public health. This new process combines the latest research in performance metrics and public health indicators with GRASP® which measures quantity, quality, and distribution across a system.

Geo-Referenced Amenities Standards Process (GRASP®) methodology, a co-creation of GreenPlay and Design Concepts, is a method of determining level of service of parks and recreation opportunities in a community. It has been developed over the past 15 years and proven on more than 100 plans representing many of the nation’s top CAPRA accredited and Gold Medal agencies. Recognizing the value that GRASP® has brought to parks and recreation planning, other firms have adopted similar methods. Meanwhile, the GRASP® methodology has continued to evolve and remains at the forefront of innovation and expertise in the field. “We are able to offer a much more detailed and refined picture of the level of service for the parks and recreation system in any community,” says Teresa Penbrooke, CEO and Founder of GreenPlay, LLC. “GRASP® goes beyond the typical lands-and-features analysis to incorporate historical values, cultural arts, and other unique aspects of your system while taking into account the quality and condition of each asset.”

Performance Metrics for Greenspace and Public Health

“The concept of parks and greenspace as policy elements with which governments promote the health and well-being of citizens emerged nearly 200 years ago. The importance of this function for parks has varied over the years, but recent concerns for public health has sparked heightened interest in the capacity of parks and other public greenspaces within the built environment to encourage and facilitate healthy lifestyles,” says Robby Layton, PhD and Partner with Design Concepts. Layton was the first to introduce the element of activity to level of service analysis in his foundational study in Raleigh, North Carolina, for his PhD dissertation.

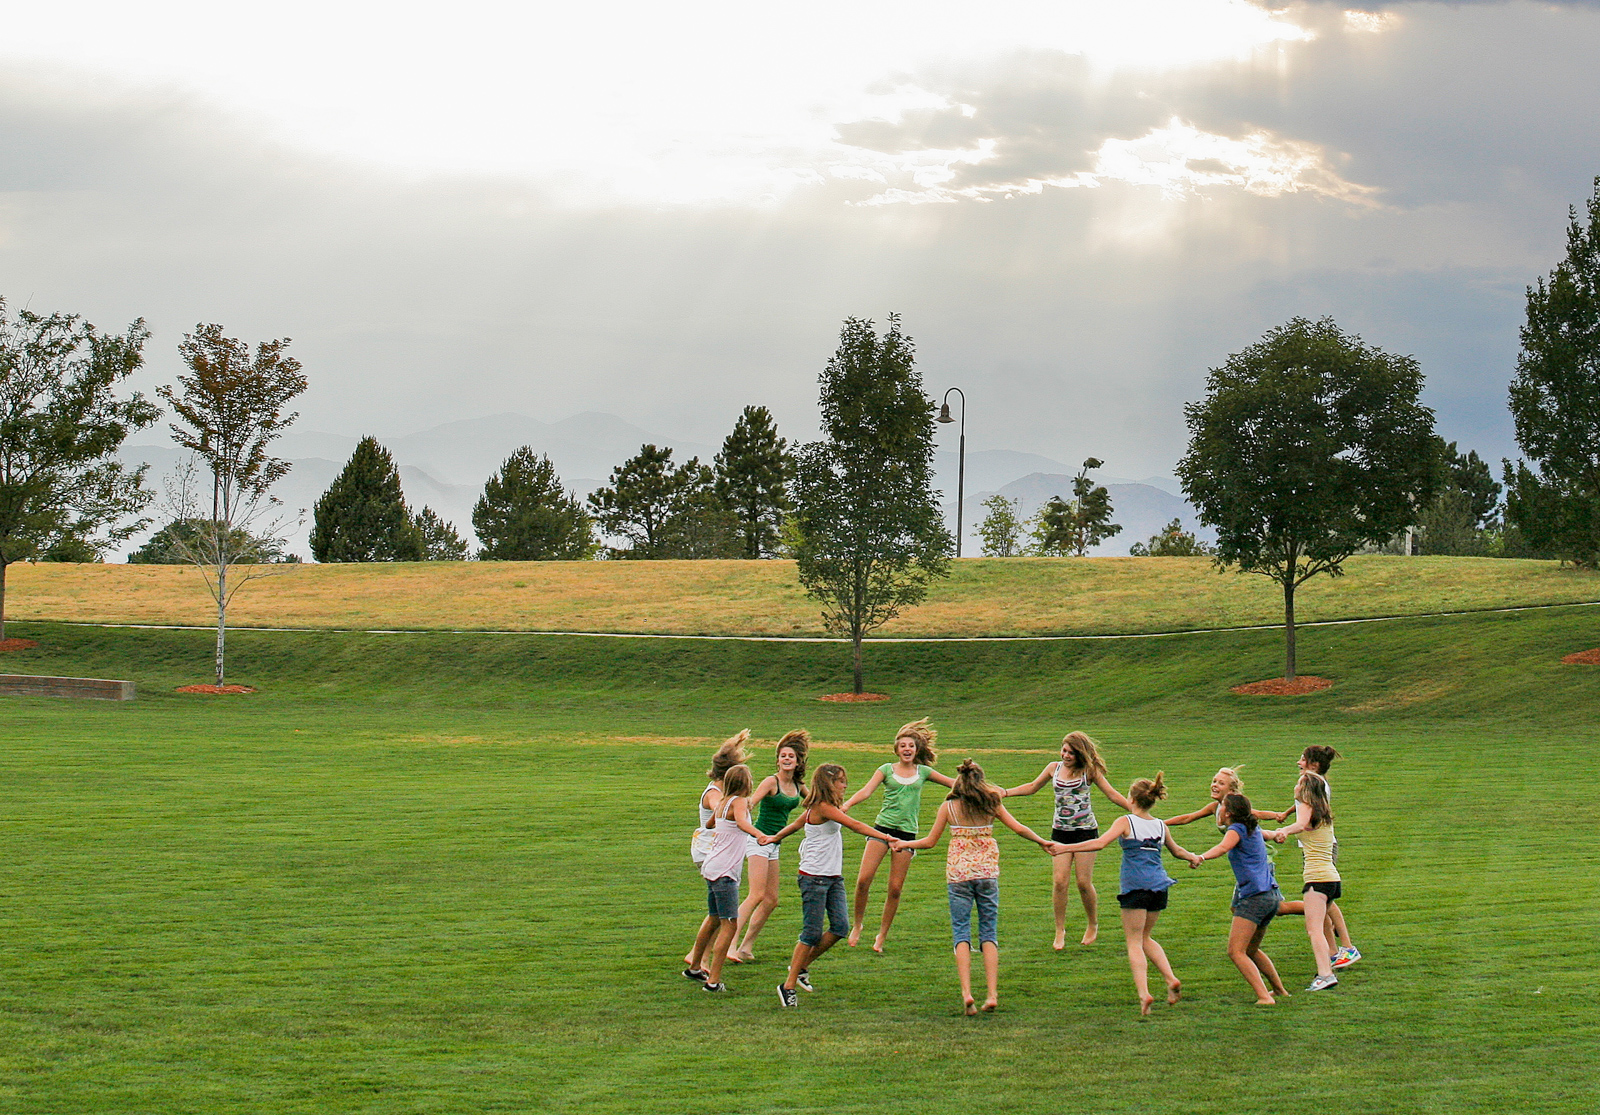
Building on the exploratory study, additional analysis was conducted in Golden, Colorado, which ultimately combined the GRASP® component based level of service analysis with anticipated physical activity levels to evaluate the parks system for level of service based on the distribution, quality, and energy expenditure of park components. The overall goal of such analysis is to identify potential gaps in the current level of service based on equitable distribution across the system. A 2010 study titled, “Parks, Playgrounds, and Active Living,” conducted by Active Living Research, found evidence that, “park proximity is associated with higher levels of park use and physical activity, particularly among youth.” The study also suggests that more parks and more park acreage correlate with higher physical activity levels.

“GRASP® Active allows a community to focus on health and well-being by using physical activity as a measurable aspect of the LOS analysis” according to Dave Peterson, RLA, Director of Specialized Planning at Design Concepts. “By applying physical activity measured in AEE (Active energy expenditure) to a GRASP® analysis, we are able to reveal a deeper analysis of what is really happening by neighborhood. This gives us a relative value in terms of each individual component’s effectiveness at generating physical activity within the population, and offers a linear relationship between per capita level of service and activity participation specific to that community. It also gives us the ability to compare activity participation rates between different parks, which when evaluated with demographic and economic data can greatly improve a community’s evaluation of recreation amenities.”

Why Level of Service?

Level of Service may be defined as the extent to which a recreation system provides residents of a community access to recreational assets and amenities. It is indicative of the ability of people to pursue active lifestyles and connect with nature. It can have implications for health and wellness, the local economy, and quality of life. Further, Level of Service for a recreation system tends to reflect community values. It is often emblematic of the manner and extent to which people are able to connect with their communities and live lifestyles focused on outdoor recreation and healthy living.

GRASP® Active Methodology

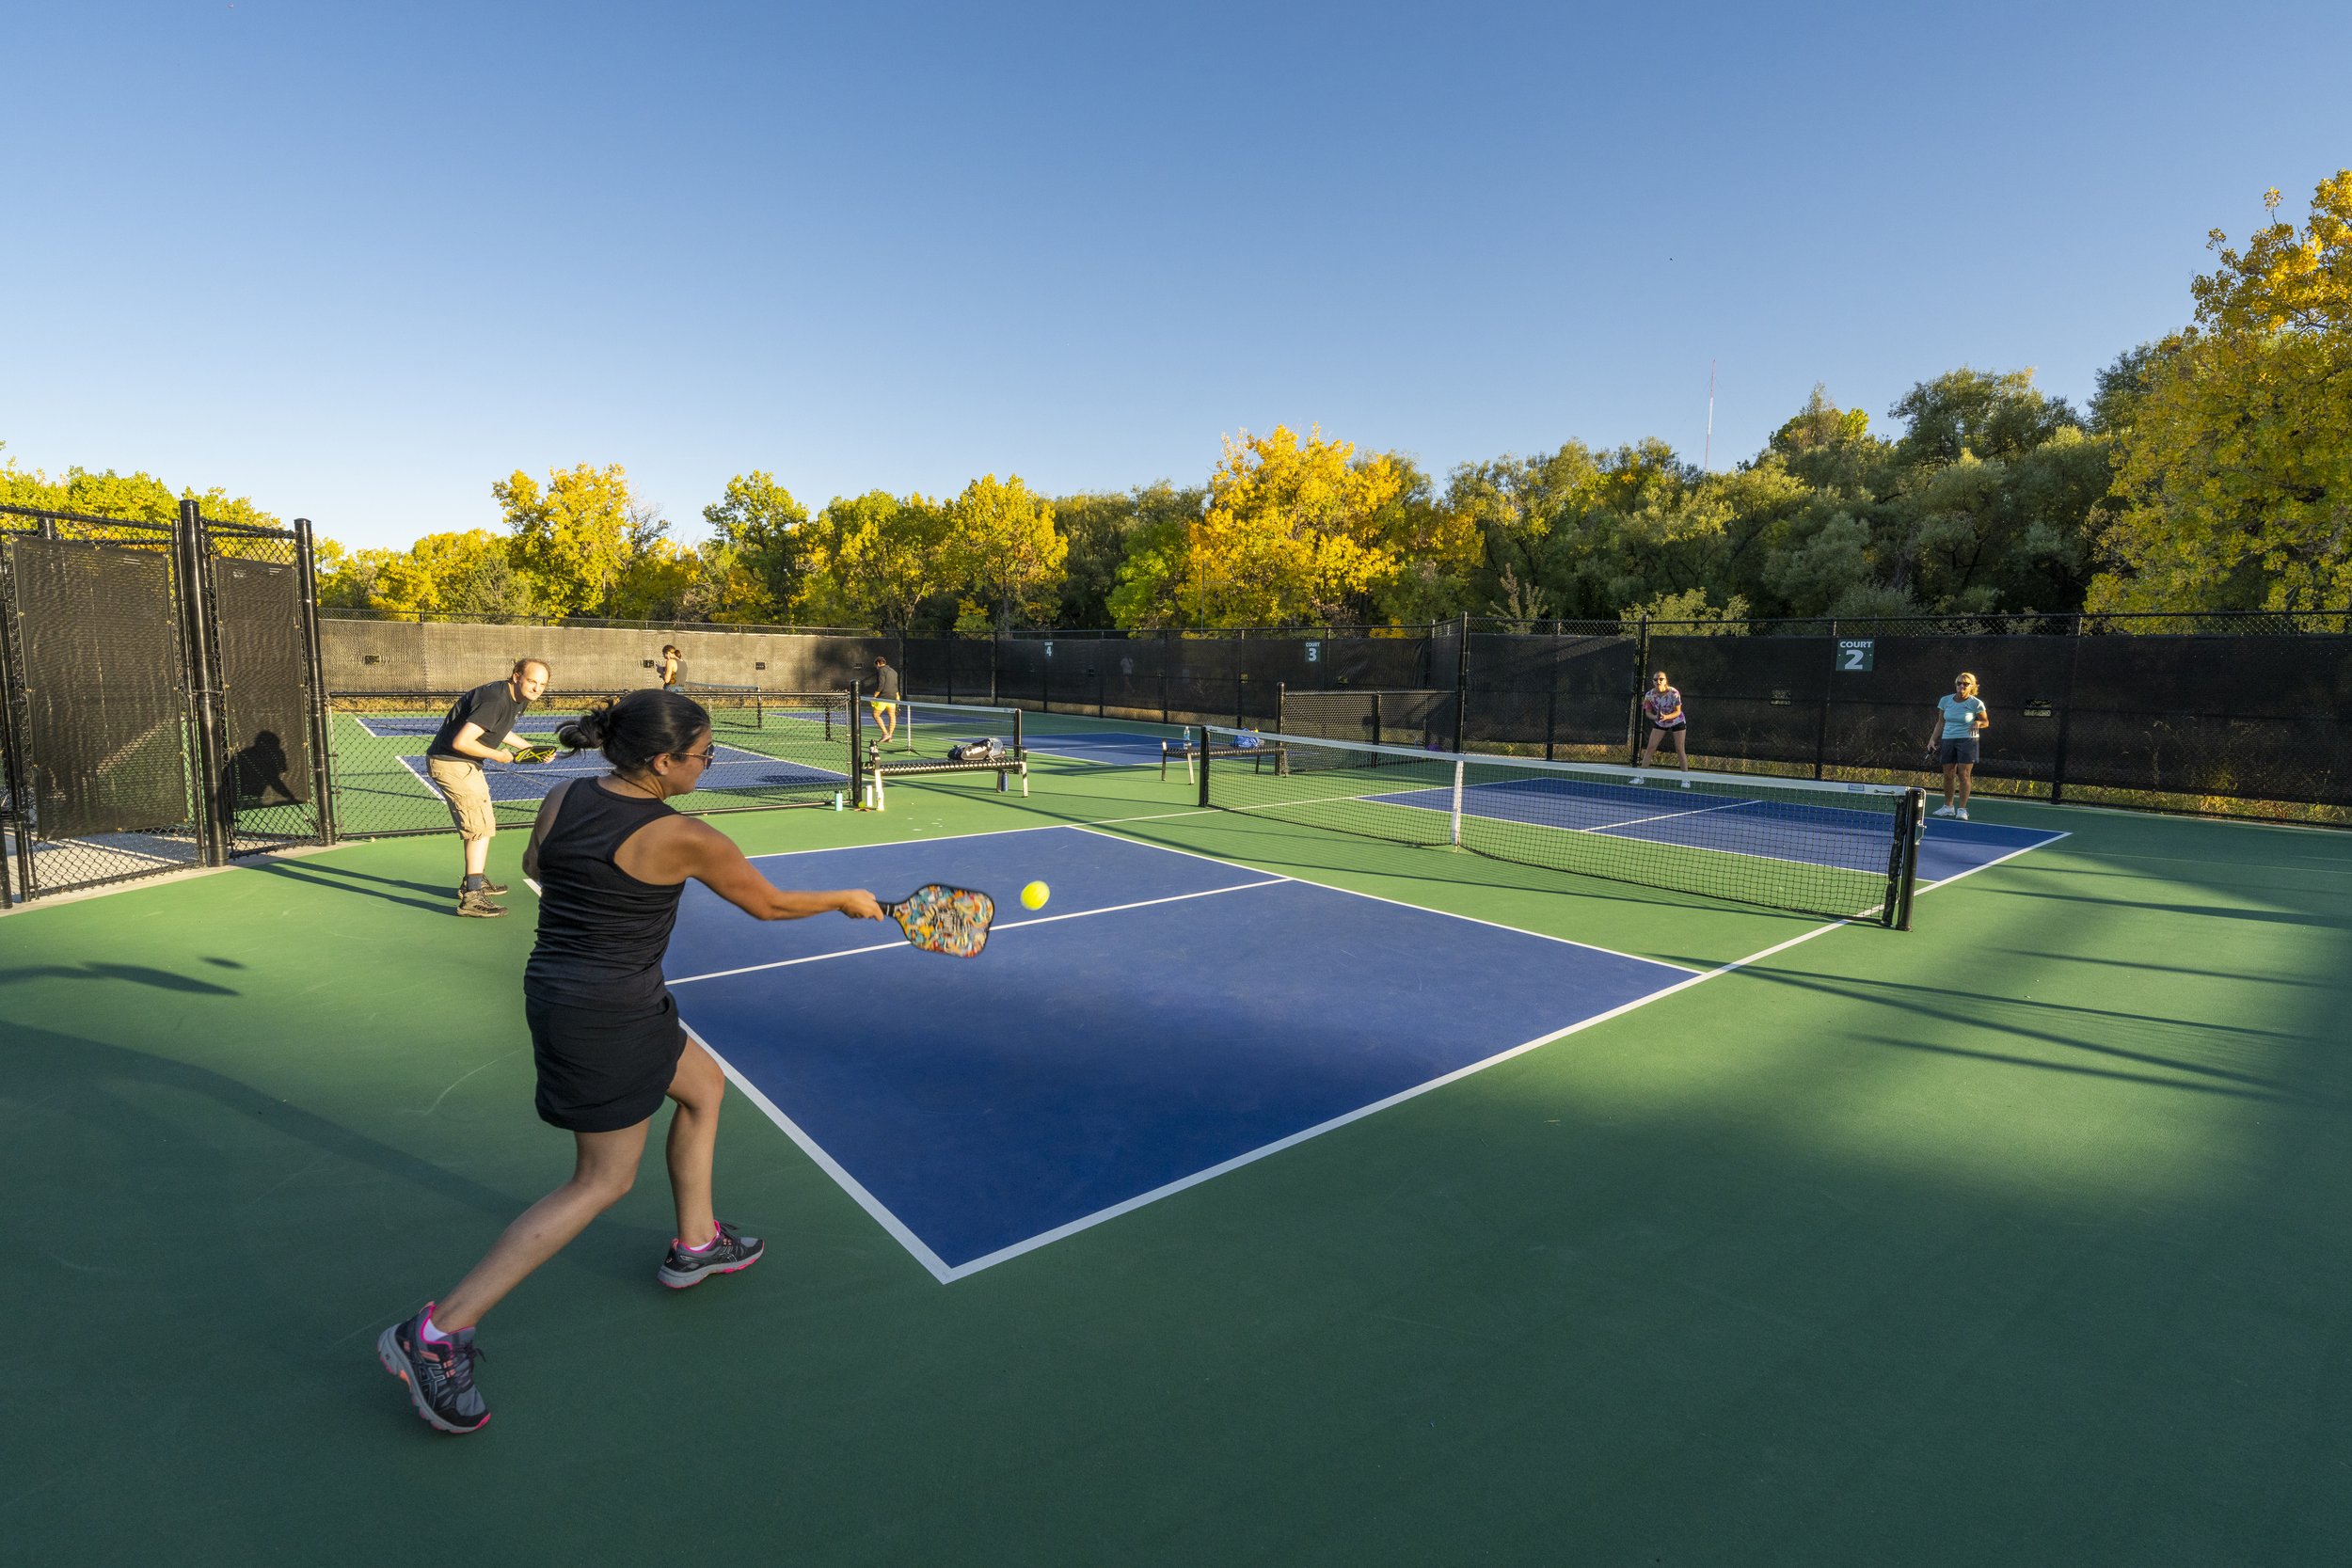
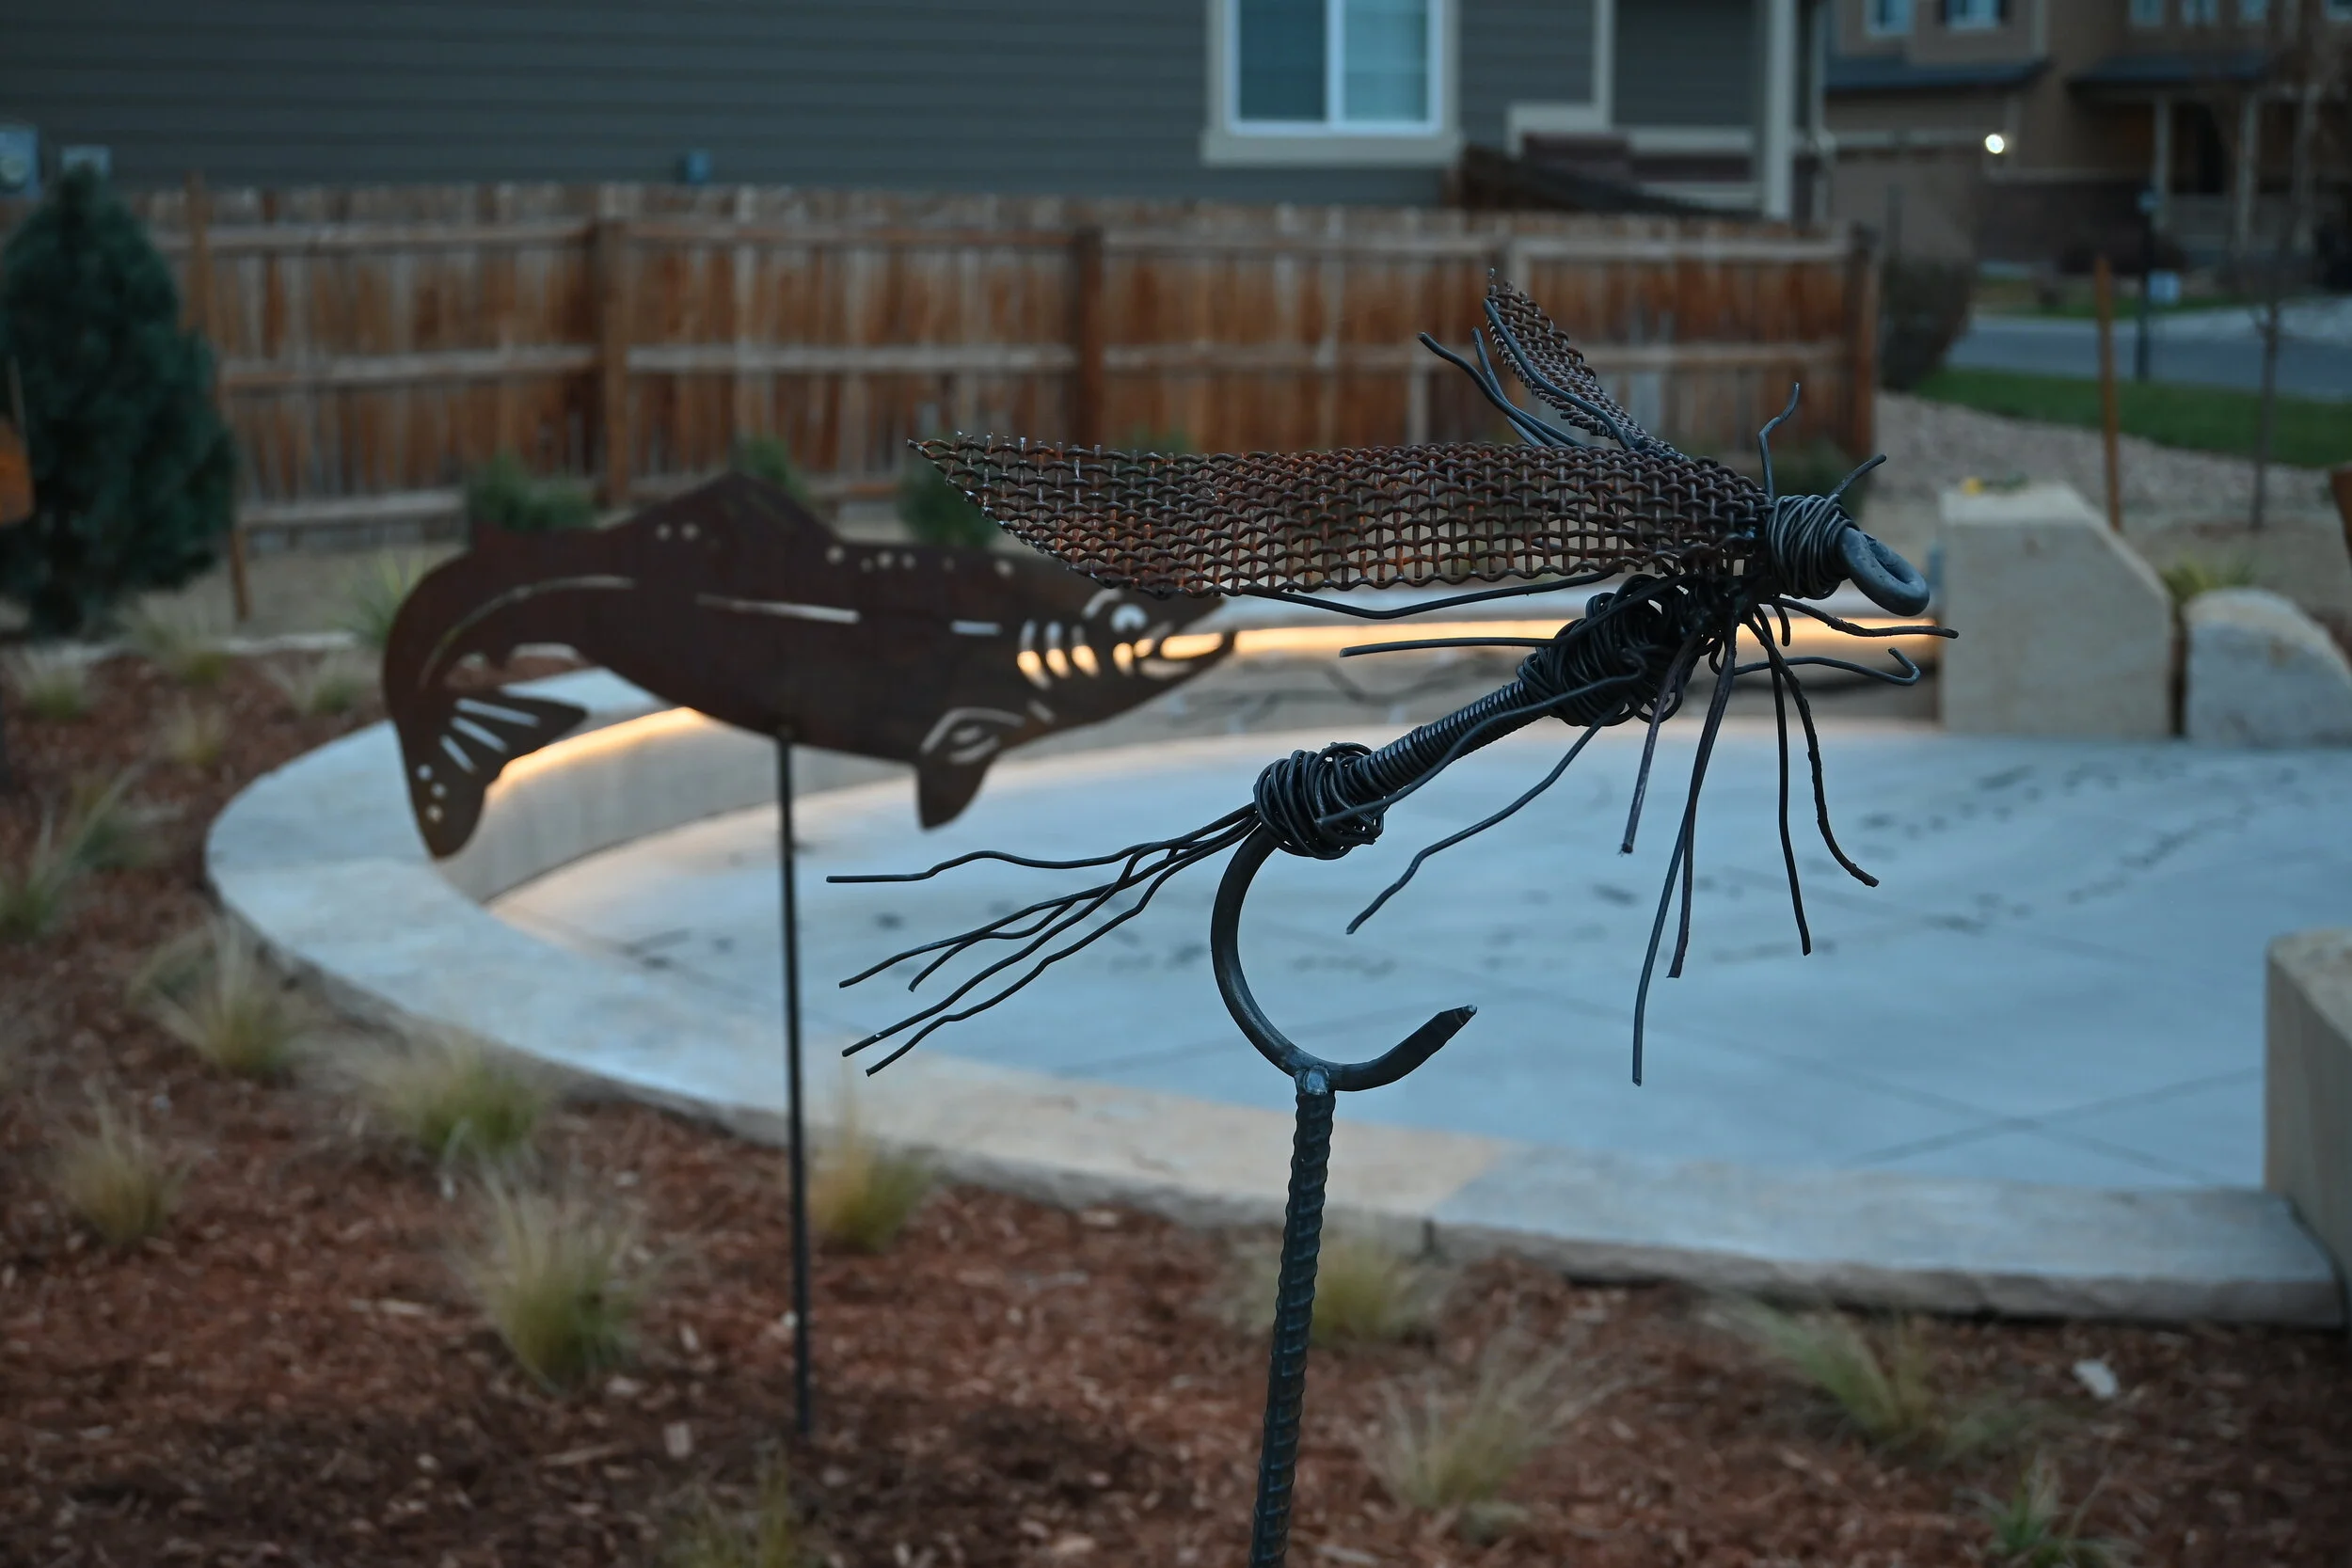
The GRASP® level of service analysis inventories and analyzes recreation system assets using an Asset Scoring method that evaluates the condition, size, site capacity, and overall quality of components as they reflect the expected quality of recreation features in a community. The analysis builds upon traditional capacity analysis, but is unique in its ability to analyze both the quantity (capacity) and quality of individual components of an entire system. These include traditional parks assets such as playgrounds, ballfields, pools, and courts, but also includes specialty components, such as trails, waterfront access, disk golf, dog parks, plazas, art, natural areas, shelters, equestrian facilities, pickleball courts, and centers that have not been previously included (or that may not yet be in place) in capacity analysis, but provide important community services.

The process was developed to provide detailed, customized analysis of a system based on the unique assets of the community to determine how effectively the current system is serving residents and visitors. For example, in the traditional capacitystyle system, all baseball fields are inventoried as, “a baseball field.” Using the GRASP® system, we add functional scoring that identifies the differences between practice fields, game fields, and youth fields, and other attributes and contributing characteristics. We are able to:

  • Determine current level of service and where improvements can be made based on walkability, quantity, and quality of any and all parks, recreation facilities, open space, and trails.  
  • Identify precise gaps and opportunities for location of future development of specific components, beyond just park land needs.
  • Provide information for prioritization of these identified gap areas based on quantified demographics and social equity variables. 

GRASP® adds more analysis on specific components, alternative providers, and programmatic locations beyond the basic parcel analysis. Specific Perspective Analyses are determined based on key issues identified by the community, and usually include detailed heat mapping, population density comparisons, area sub-analysis, comparative charts of scoring, programmatic analysis, and/or evaluation of specific key components that may be priorities for the community.

With GRASP®, in addition to the System Resource Maps, we provide a full Community Inventory Atlas, which includes aerial mapping graphics and textual descriptors for each site. Once fully analyzed, the data will provide the basis for recommendations for making improvements to address unmet needs for both active and passive recreation for many years to come. This detailed dataset can also provide a strong basis for future digital assets management and maintenance plans.

Beyond quality and functionality of components, however, GRASP® also takes into account important aspects of a park or recreation site that are easily overlooked. Not all parks are created equal, and the quality of a user’s experience may be determined by their surroundings. For example, the GRASP® system acknowledges the important differences between these identical playground structures depicted in the following photos. In addition to scoring components, each park site is assessed for its comfort, convenience, and ambient qualities. This includes the availability of amenities such as restrooms, drinking water, shade, scenery, etc. These modifier values then serve to enhance or amplify component scores at any given location.

Park Components, Physical Activity, and Average Energy Expenditure Rankings

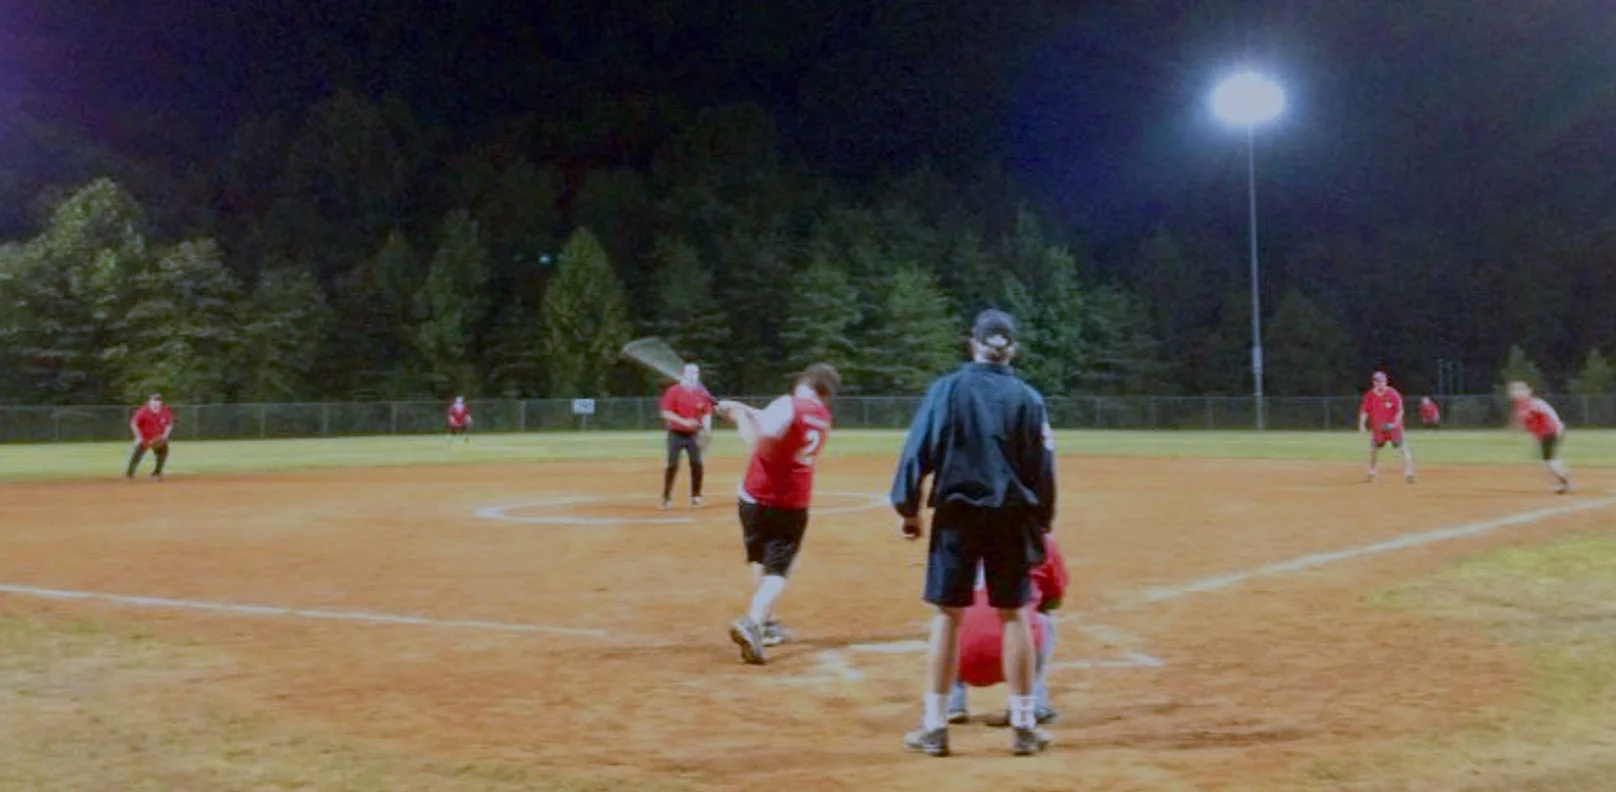
GRASP® Active builds on this methodology, analyzing the system with regard to energy expenditure. Energy expenditure (EE) can be defined as the amount of energy or calories a person exerts for a given activity. The contribution of individual components toward physical activity varies. One study found that gymnasiums and baseball fields were the busiest areas, while areas most frequently used were dog parks, walking paths, water features, and multipurpose fields. The North Carolina State Cooperative Extension Service provides a listing of features commonly found in parks and a rating of the average energy expenditure within each feature by all participants. Another study conducted through Active Living Research titled, “Cost Analysis for Improving Park Facilities to Promote Park-based Physical Activity,” looked at visitors in parks and classified behaviors of users based on three activity levels: “sedentary (such as standing, sitting, lying down), moderate activity (such as walking and other moderate intensity activities), and vigorous activity (such as running, climbing, jumping).” The list of features in this study can be approximately equated to the set of GRASP® component modifiers described earlier. Using the feature list and a simplified low, medium and high rating for energy expenditure, each GRASP® component “has a relative value in terms of its effectiveness at generating physical activity within the population.”

Participation and Demographic Analysis

While much of the GRASP® analysis and data concentrate on parks assets provided by the community, it is also be informative to look at how resident and visitors participate in activities associated with park and recreation assets. This technique was utilized in the Parks and Recreation Master Plan project for Golden, Colorado. Using data enrichment made available by Esri, overall activity participation rates for 10 common activities often associated with parks can be determined. The following graphic represents overall participation rates by Golden citizens for each activity. Walking for exercise has the highest participation rate at almost 25 percent of Golden residents.

Tennis has the lowest participation rate at about five percent of Golden residents. It can be very informative to compare participation rates from different areas of the community. GRASP® Active enhances this data by visualizing this data with demographic information. In the examples shown below, the high service area A is compared to a gap service area D.

Residents in area A, the high service area, are more likely than an average city resident to participate in 9 of the 10 activity areas. Only “walking for exercise” falls below the city average participation rates. There are 2,261 residents in this area with a relatively young median age of 25.5. Median household income is about $52,000.

With better measures of park quality, systems of greenspace can be planned to help achieve many public health and wellbeing goals including physical health, mental health, social health, environmental health, and economic health. - Robby Layton, PhD

Area D has the lowest median household income of any of the identified areas at about $43,000. There are 2,124 residents with a median age of 32.5 yrs. Residents in this gap area are less likely to participate in individual activities but more likely to participate in sports such as baseball/softball, basketball, football and Frisbee as compared to city averages.

Parks offer opportunities for fitness, recreation, relaxation, education and community building, giving children a safe place to play and adults a place to stay active. GRASP® Active offers the highest, state-of-the-art Level of Service Analysis methodologies available, using the latest research with proven processes and tested algorithms to make the data as accurate, thorough, and meaningful as possible. This enables communities to prioritize Level of Service improvements based on the most complete information.

References:

Cohen, D.A., Marsh, T., Williamson, S., Derose, K.P., Martinez, H., Setodji, C., McKenzie, T. (2010). Parks and physical activity: Why are some parks used more than others? Preventive Medicine (50). S9-S12.

Floyd, M., Suau, L.J., Layton, R., Maddock, J.E., Bitsura-Meszaros, K. (2015). Cost analysis for improving park facilities to promote park-based physical activity. North Carolina Cooperative Extension.

What Really Matters? The Role of Environmental Characteristics of Nearby Greenspace in Opinions of Park System Adequacy and Predicting Visits to Parks. Layton R., PhD, FASLA, PLA, CLARB, CPRP – https://repository.lib.ncsu.edu/ handle/1840.20/33398

Ball Field Study Hits Home Run. Dave Peterson, Carter Marshall. ArcNews, Spring 2015. pgs: 26-27. esri.com/arcnews

The Trust for Public Land – https://www.tpl.org/media-room/trust-public-land-makes-park-information-database-andplatform-available-millions

From Recreation to Re-creation. New Directions in Parks and Open Space System Planning. Megan Lewis, General Editor. American Planning Association. Report No. 551. pgs: 54-55.

Playbook: Analyzing Your Level of Service. Teresa Penbrooke. Parks and Recreation Magazine, October, 2007. pgs: 18-19.

Sheridan's Safe Routes to School - Be Safe Out There!

Remember being a kid? You walked or biked everywhere, all the time.  And walking to school was the worst.  As I recall it, I walked uphill both ways.  In a snowstorm.  Even in June.

Believe it or not, kids who want to get to their school and play destinations today may have it worse than we did back then.  Creepy strangers.  High speed traffic.  Dark alleys.  

But a recent youth engagement effort in the City of Sheridan, Colorado set out to make the community safer for kids .  The Sheridan Safe Routes to School (SRTS) project engaged 28 students at Fort Logan Northgate School to find out where they like to go for fun, where they feel safe or unsafe, and how they get to places they like to play and hangout.  They took photos of their world and worked with a local spoken work poet to describe the images using their own voices.

Thoughts of one youth participant:

“The broken sidewalk reflects on us as a city. Sidewalks like this reflect poorly on our city and show visitors how little we care about the safety of not only our pedestrians but our bikers too."

The results of the students’ hard work were compiled in an interactive Sheridan Safe Routes to School Web Map, where users can see youth photos and comments, and begin to understand their world as they see it. 

The students cited flowers, green spaces, police bicycle patrols, and well-designed sidewalks as positives. Places in open view such as schools and parks were preferred. Among the kids’ greatest concerns were drunk people, drug dealers, and potential predators. Environmental factors such as traffic, walking hazards, and barbed wire also made the list.  Places with poor visibility or limited access such as dark woods and alleyways are avoided.   Interestingly, many locations the kids use for recreation were perceived as safe by some, and unsafe by others. 

Several ‘Signature Projects’ were developed as a result of the youth engagement process.  The kids' work inspired the passing of a $33 million bond in Sheridan for infrastructure improvements, and they were lauded by the Mayor for their efforts in 'giving us our marching orders' on how to spend the funds. 

This successful project was co-led by Jennifer Henninger, Sheridan City Planner, and Cindy Heath, Executive Director at GP-RED, a non-profit initiative of our old friends at GreenPlay, LLC.

Read more about Sheridan and other Safe Routes projects here


Close to Home

As part of his research into the factors that affect resident’s perceptions of park system adequacy, Robby compiled a set of statistics for over 1,800 people that tells a story about the footprint of parks in a segment of America. It reveals that the “typical” household has access to approximately an acre and a half of park land within a ten-minute walk from home, along with other insights. The results, as summarized in an article in the November issue of Parks & Recreation Business, should be of interest to planners and policymakers across a range of community types and sizes.